Get Poisson Pilled
On hash rate estimation

Hash rate can not be directly measured. Instead it is estimated by observing the number of blocks found over an arbitrary time period and asking “what quantity of hash rate would produce this frequency of blocks, on average?”.
The “on average” part is important, because block production follows a poisson distribution. If the last block was just found, on average the next block will arrive in 10 minutes. If the last block was found 10 minutes ago, on average the next block will still arrive in 10 minutes. No matter how long ago the last block was found, the next is always expected to take 10 minutes to find from the current moment. Sometimes it arrives in less than 10 minutes and sometimes it takes longer.
The distribution of interblock time looks like this:


Each of those dots represents the time it took to find that block, and as you can see it’s all over the place and random. It’s that randomness that makes the “number of blocks found over an arbitrary time period” piece I mentioned earlier pretty volatile if the time period is sufficiently short.
The precision of a hash rate estimate can be improved by playing with two different levers, but both basically amount to increasing the sample size.
Use a longer time period: you observe more blocks and have a larger sample size to make an estimate from, reducing variance in your estimate
Use a higher frequency event: you can increase your sample by using mining pool shares (which occur proportionally to block production), again reducing the variance in your estimate
Both of these methods can reduce (but not eliminate) the uncertainty in your hash rate estimate but also have downsides. Using a longer time period means your estimate is less responsive to short term movements and you’re stuck waiting for a larger sample while people declare Bitcoin dead on Twitter. Mining pool shares happen in real time and don’t lag but you have to trust data reported from pools (I guess they could publish the hashed blocks where shares were earned to give proof, do they do this?) and the data may not have full coverage.
Either way, we could be doing a better job conveying the uncertainty in these hash rate estimates so that people don’t continue to make the same mistakes:


Confidence intervals are a good way to communicate this uncertainty, and I recently added them to the Hash Rate chart at BitcoinKPIs.

The orange line is the daily Hash Rate estimated from the daily block count, while the blue line is the 7-day moving average of the daily Hash Rate estimate. The grey band in this chart is the range where we would expect the true hash rate to fall on 95% of days given the block frequency observed on that day. As you can see the bands are incredibly wide, usually +/- 20% on the daily number.
So next time you see someone cite a daily hash rate number on Twitter, think to yourself that the true hash rate for that day could easily be 20% greater or 20% less, just based on normal statistical noise!

The confidence intervals are fairly easy to calculate, just a few lines of Python using the CoinMetrics community data and a stats library.


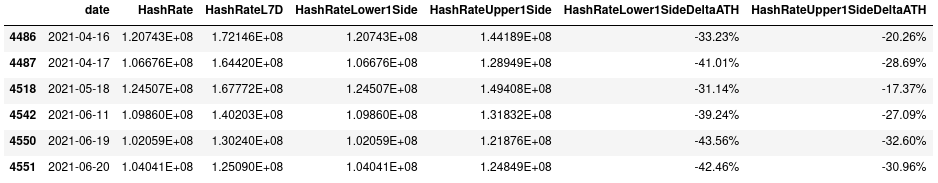
How does the recent dive in hash rate compare to the other periods of rapid hash rate decrease we’ve seen in the past few months? The April 16/17 decrease was by far the largest, with an estimated fall between 21%-35% compared to the prior week average. The decrease for May 18 was also more violent (11%-25% compared to prior week), while the two downtrends in June so far were a bit more measured (6%-21% decrease against prior week avg).
Note that all these numbers are compared against the prior 7 days before the decrease, not the all time high, so they are multiplicative (although there were periods of recovery in between); the decrease in hash rate since the all time high is larger.
Adam Back estimates that the decrease against hash rate ATH is -40% in the tweet above. Using my methodology I estimate we are down 31%-43% against the ATH, fairly close to his estimate but mine gives cover for more optimism.
Next time you see someone post a hash rate chart on Twitter, I implore you to respond with the hash rate confidence intervals chart from BitcoinKPIs! I think this can be a powerful visual to teach people how uncertain these estimates are.
How to Poisson Pill:
Go to https://bitcoinkpis.com/security
Select “Daily” date granularity from the drop down, this is the only granularity with the CIs
Use the date range selector to grab the date range you want
Hit the camera button on the chart to download an image of the chart
Dunk on poisson naive Twitter commentators with your chart brimming with statistical nuance


Like this post? Subscribe to Stack Stats for more Bitcoin data science content. Follow me on Twitter too!