A few months ago I published my research into a metric I created to quantify the flows of miner coins: COHI: Coinbase Output Herfindahl Index. The first version of the metric published in that article had one big drawback:

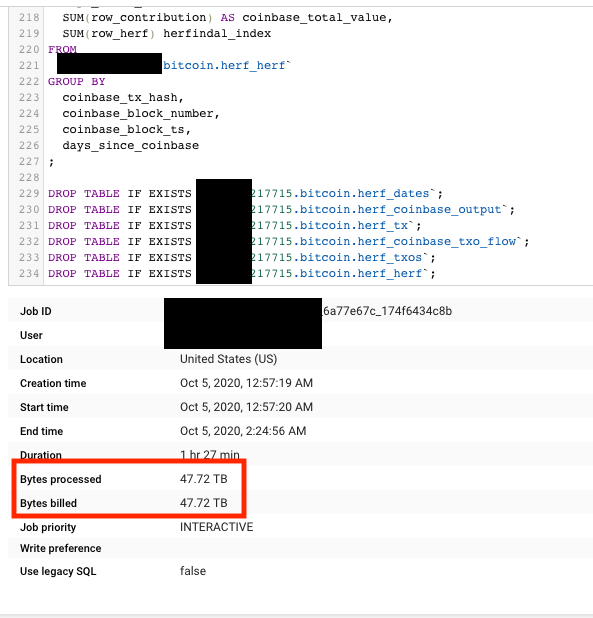
Since then I refined the COHI metric, burning through a few TB of data in the process…


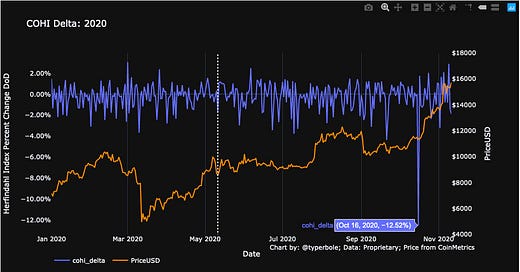
I call the new version COHI Delta, since it measures the day over day percent change in the herfindahl index of coinbase outputs. This allows us to attribute the movements in miner coins to the day the coins were moved, rather than the day it was mined.
When looking at COHI delta for 2020, one day jumps out as a clear anomaly. On October 16, the mean COHI delta was -12.5%! What is more interesting is that this is immediately preceding the face ripping rally from $11k to $18k.
How much bitcoin are we talking here? In 2020, we typically see about 200-300 coinbase outputs with large COHI delta values per day. On 10/16 1,100 coinbase outputs had large COHI delta values.
This amounts to ~ 7.5k BTC given current block subsidy levels, something in the ballpark of $83M in BTC at the price level at the time (about 1/5 a Microstrategy, my new unit of Bitcoin accounting). Curiously there is another spike in COHI delta mid July right before that price rally. Since the amount of Bitcoin here is somewhat small I doubt these are moving the market that much, but it’s fun to do some blockchain archeology even if we can’t come close to causal attribution.
I spot checked a random sample of these 1,100 coinbase outputs to see who mined them and it looks like a bunch were from Huobi.pool. If you look at mining pool outflows on CryptoQuant, there doesn’t seem to be any spike on 10/16:
But the chart above relies on labelling of miner addresses and they don’t seem to have data for Huobi.pool specifically. So I’m not sure this disproves the trend observed in COHI Delta. In fact this is a strength of COHI as it doesn’t rely on any address labelling and everything is deterministic WRT the onchain data.
The other period in Bitcoin’s history that had these big COHI Delta swings was 2016:
I see a lot of people comparing this moment to 2016, which is an interesting (and optimistic) comparison. COHI Delta seems to agree.
Here is the full history of COHI Delta:
I did think about doing some moving averages to smooth the time series but those didn’t yield better signal. Here is the 28 day moving average:
So where do I go from here with COHI?
It looks like COHI Delta is useful for spotting very rare anomalous flows from miner addresses, and the original COHI is better for looking at long term trends but lags.
Given the rarity of interesting patterns in COHI Delta and the lag for normal COHI, I think utility is limited. COHI is hard to calculate and convoluted.
CoinMetrics just published their approach to this problem and I thought it was a good solution, much simpler and yielded good results. Read about it here.


